The Limitations of Running a Workload Generator In the Same JVM as the System-Under-Test
When you evaluate a system with a garbage collector and want to understand its tail latency, you often see SPECjbb2015 or DaCapo used. While both offer corrective measures for coordinated omission, only SPECjbb2015 can run the workload generator and backend server in the same JVM, as well as separate them into different JVMs. This post is a deep dive that uses SPECjbb2015's flexibility to explore and highlight the risks of running the workload generator in the same JVM as the backend.
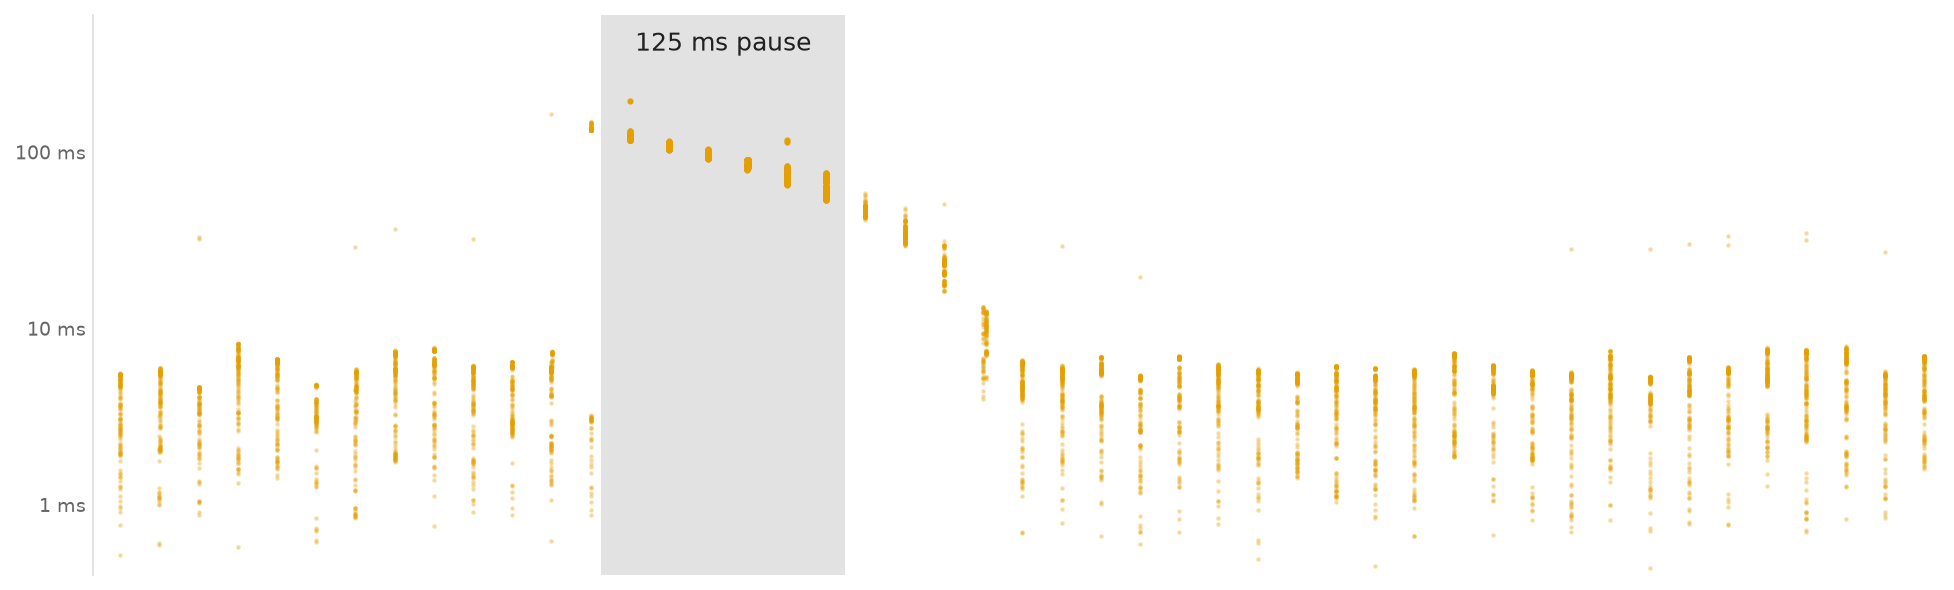
This is a research exploration of SPECjbb2015 using p99 response times. We do not use any of the official benchmark’s offical scores and all configurations and results in this article should be considered non-compliant.
1. Background
Workload generators that are used to measure latency need to consider the issue with coordinated omission. The problem with coordinated omission originates from the workload generator using a blocking call to issue a request which blocks the next request until a response.
While we can correct the submission time, a correction cannot recreate the real traffic that would have arrived in the backend queue if we didn’t have to wait for a response before sending the next one. One way to correct submission time is to record the time a request is scheduled to be submitted. Any subsequent delay in submission due to blocking calls will be accounted for, since the response time is calculated from the scheduled time rather than the actual submission time. That said, if the workload generator is suspended due to GC and therefore unable to issue scheduling requests, that is hard to correct.
For a workload generator we typically recognize three points in time per request:
- The scheduled time (when a request should have been submitted)
- The actual submit time
- The response time (also known as the time a response is recieved)
The actual and scheduled submit time may differ when a workload generator cannot issue the next request before a response is recieved for the current one.
1.1. SPECjbb2015
This is a benchmark developed to test Java server performance. A design document describing it in detail can be found here. But the simplified and short summary (omitting details irrelevant for this story) is as follows: It simulates a world-wide supermarket company. To this end it includes a workload generator, that issues fire-and-forget requests (saturate) and performance profiling requests (probe). Probes measures response times and blocks until a response is recieved. Measuring response times and issuing requests inside a blocking function needs to consider coordinated omission. Requests do not exist in a vacuum. A workload generator should generate them at some bounded or unbounded rate. Regardless, if the next request in line cannot be issued because the current one is stuck waiting for a response—and, say, it takes a long time because the backend is doing a long GC pause—the results skew away from the intended behaviour. SPECjbb2015 implements a correction for coordinated omission by recording the scheduled time and using it as the basis for calculating response times.
SPECjbb2015 offers multiple ways of running the benchmark, which differ in how the components are isolated from each other and how they communicate:
| Mode | Separate JVMs | Serialized traffic | Network stack | Compliant |
|---|---|---|---|---|
| Composite | ❌ | ❌ | ❌ | ✅ |
| Composite-Net | ❌ | ✅ | ✅ | ❌ |
| MultiJVM | ✅ | ✅ | ❌ | ✅ |
| Distributed | ✅ | ✅ | ✅ | ✅ |
2. Experimental setup
We use Composite-Net and Distributed (pointed to localhost). This ensures that communication costs are equal and that network stack is involved. Using Composite/MultiJVM would have been an equally valid setup.
Moreover, SPECjbb2015 v1.04 and OpenJDK 27 with -Xlog:gc*,safepoint using Linux kernel 6.8.0. Transparent huge pages are disabled for all collectors. A JFR event is added to record all request times with minimal overhead and observer effect. Injection rate (IR) is set to 6000 requests per seconds, at least 240 seconds of steady state, and ten separate JVM invocations per cell. The system under test has the following specifications:
1
2
3
4

cpu                 AMD Ryzen 9 5900X 12-Core Processor
cores               24  (12 physical, SMT enabled)
memory              128 GB
governors           24 x performance   (all cores)
Distributed is deliberately given total more memory than Composite-Net, so that its latency results cannot be attributed to being starved. Additionally Composite-Net gets half of the CPU cores, so in this mode only half of the CPU is used. In Distributed backend runs on the unused half and controller and txinjector runs on the other half. This controls for the fact we would have three JVMs with additional overhead, where each JVM has their own set of threads to do GC etc.
| Composite-Net | Distributed | |
|---|---|---|
| composite | 16 GB | - |
| backend | - | 16 GB |
| controller | — | 2 GB |
| txinjector | — | 4 GB |
| total committed | 16 GB | 22 GB |
All heaps set with -Xms/-Xmx and +AlwaysPreTouch. Hence, memory is committed and touched up front to reduce variance. Flags that affect internal threading are pinned so that configuration changes are robust against ergonomic choices.
2.1. p99 Response Times in Composite-Net vs Distributed
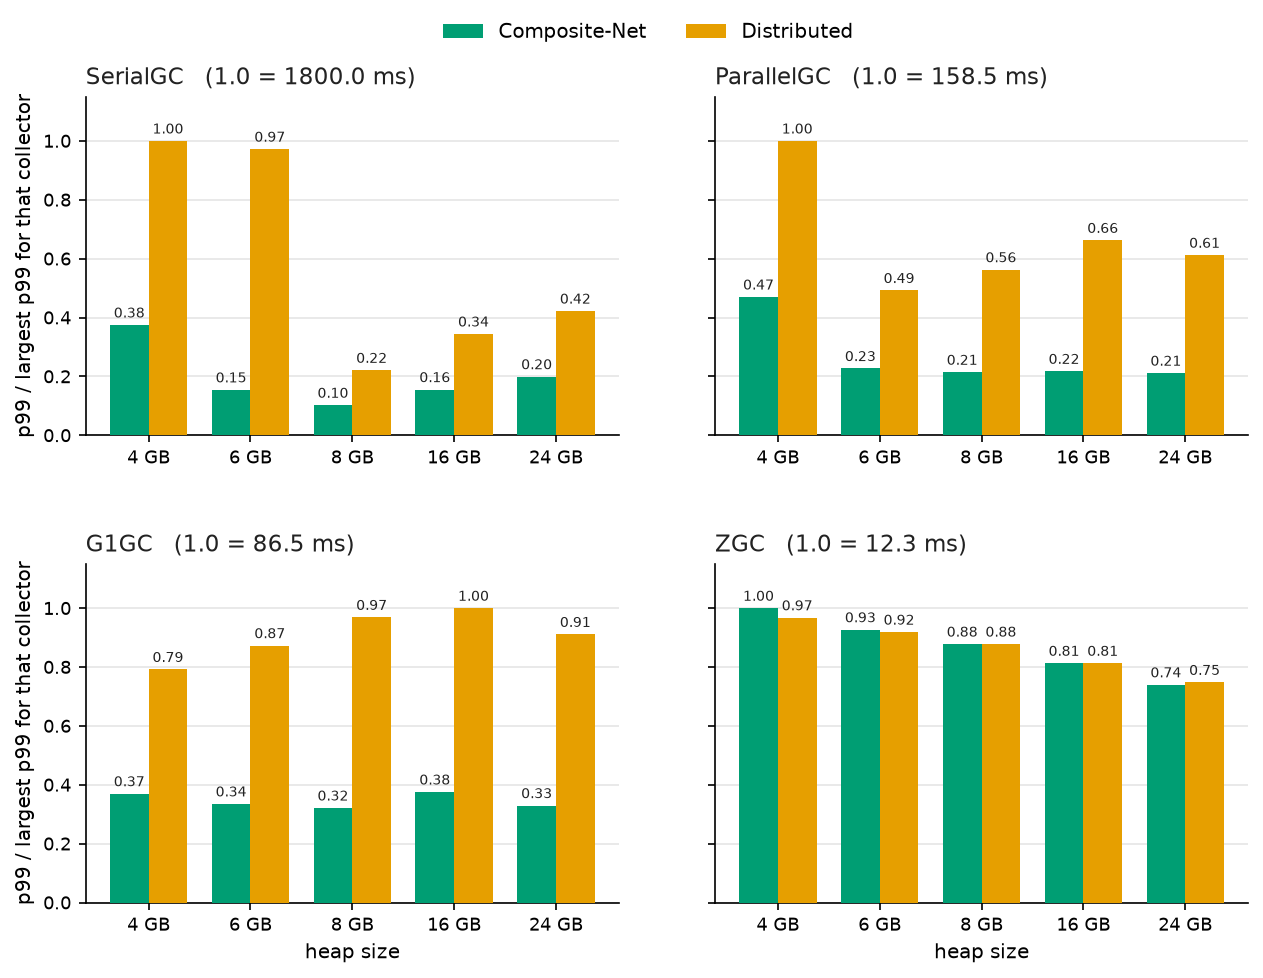
In Figure 1 a large gap (roughly 2-3x) between Composite-Net and Distributed for three collectors that have non-trivial GC pauses can be seen. ZGC whose pauses are < 1ms does not contain any discrepancy. In comparison, G1 has a default pause time target of 200 ms. This supports the hypothesis that in Composite, requests can’t be scheduled if the entire application is blocked during GC pauses.
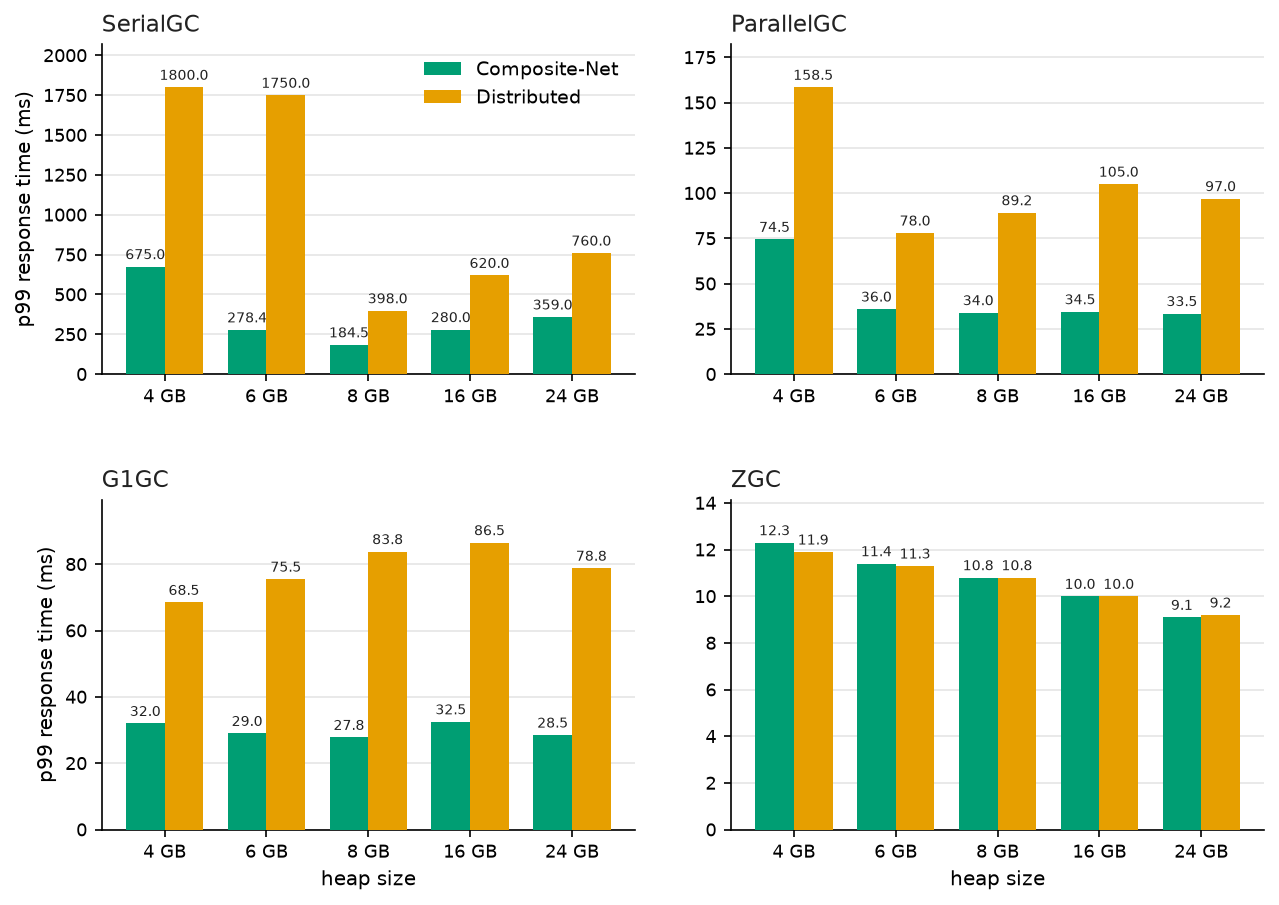
It is also interesting to consider the absolute values, see Figure 2. The service level agreement difference between a 34ms response and 100ms is huge. And the delta for Serial at 6 GB, 1750ms vs 278ms is an order of magnitude large.
2.2. Explaining the Discrepancy
We dumped all scheduled, actual submit and recieved timestamps, and using GC logs we can match and plot responses in relation to a GC pause. To this end we selected Parallel GC 16 GB and selected a GC pause of similar length from both modes. In Figure 3 the x-axis is the scheduled submit time, and y-axis is the response time. The pause depicted in Distibuted is a GC pause in the backend. The workload generator has ample of memory and almost no GC activity. It is clear that since no requests are being scheduled in Composite-Net during a pause, this explains the large discrepancy we can observe in Figure 1–Figure 2.
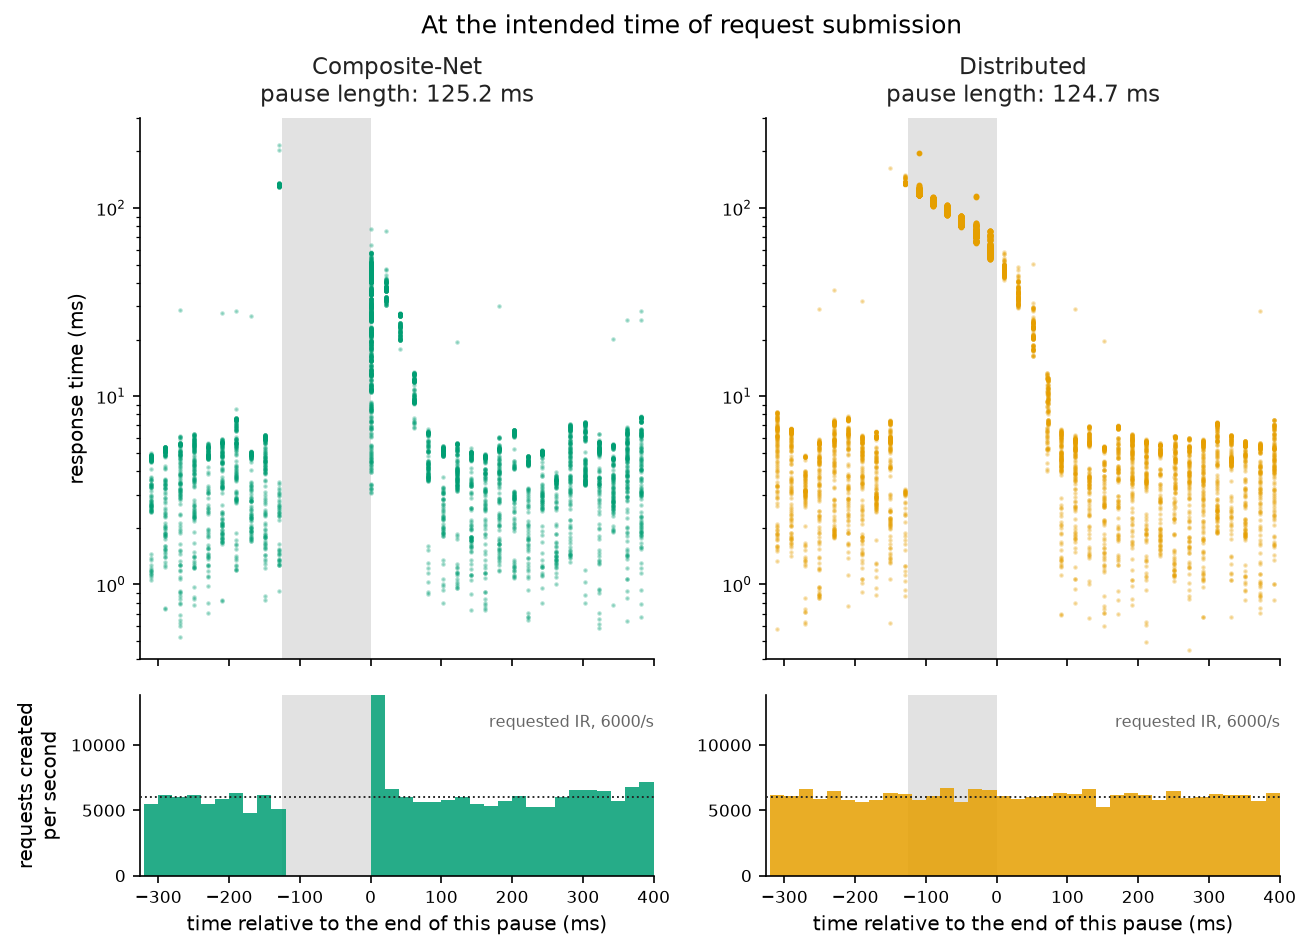
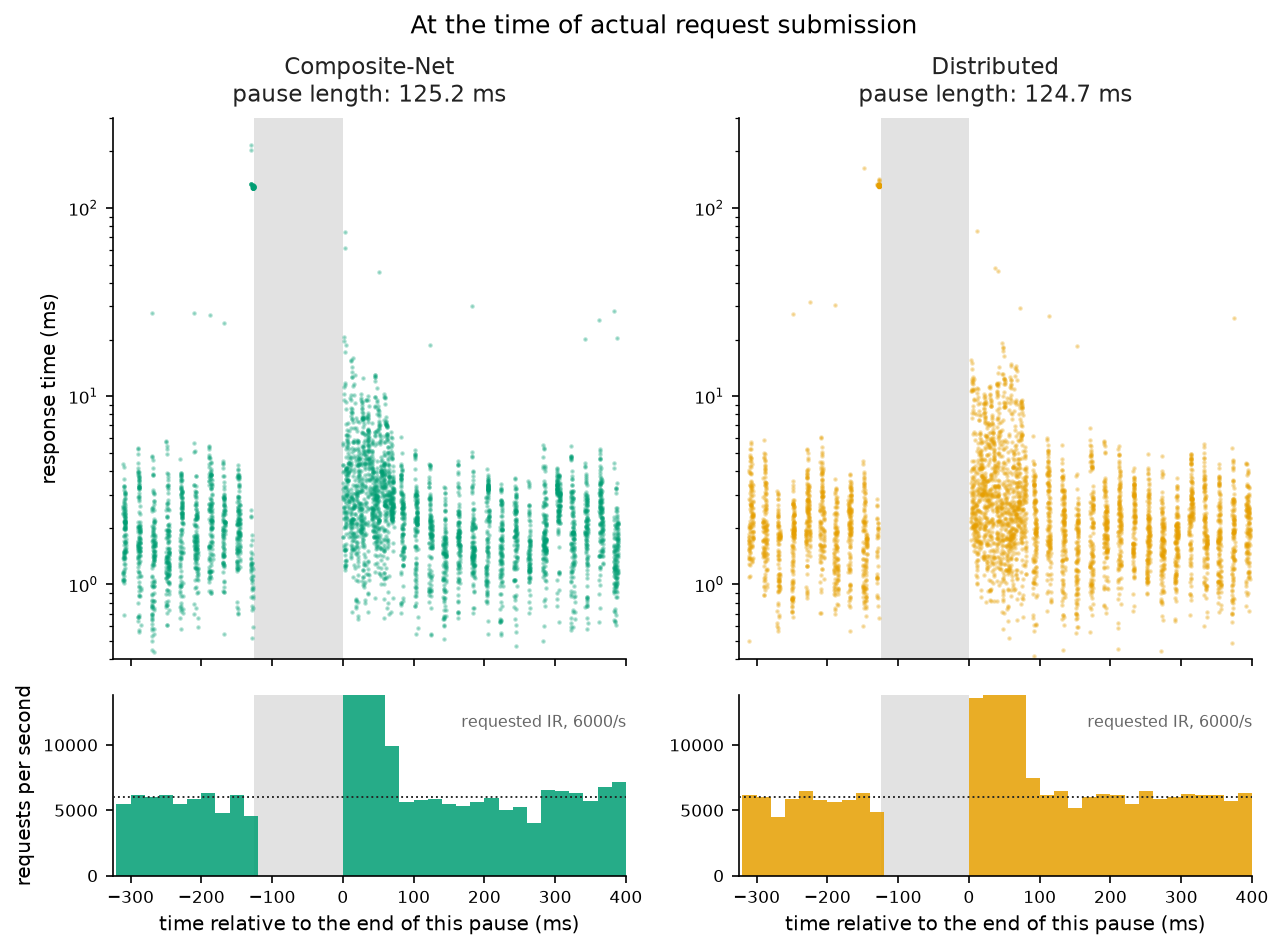
It is also worth highlighting that the entire difference we can observe here is the inability to schedule requests. In Figure 4 we depict actual submit times and it is clear that since the backend is busy with a GC pause and we can’t submit until we get a response, the choice to record the scheduled submit time over actual submit time is the sound choice.
3. In Summary
SPECjbb2015 already provides configurations for users that particularly care about latency. MultiJVM and Distributed put the workload generator in its own JVM, and switching to this is easy. We encourage all users interested in latency to use only these modes to facilitate simpler analysis and a stronger correlation of absolute response times to end-user systems.